- PRODUCTS
- MODEL LIST
- APPLICATIONS
- SUPPORT
- SALES/SERVICE
- BLOG
- ABOUT
Login
November 2019 Newsletter
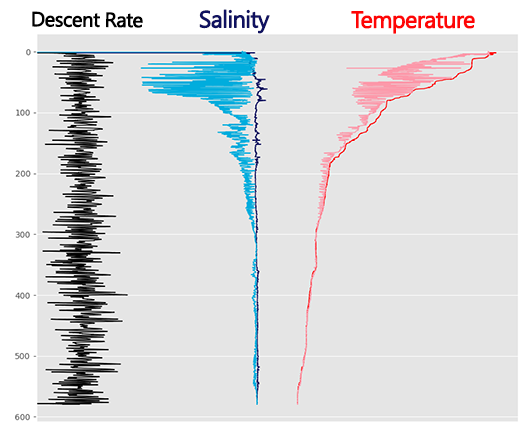
CTD Profile: “Wiggles” in Data
The data above come from a profiling CTD, deployed in sea conditions that caused approximately 1-meter ship heave. Two things stick out – relatively unchanging salinity data during the downcast, and noisy data during the upcast (shown in light blue and pink). Can you identify the cause of this problem?
Find the Answer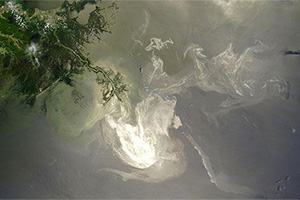
Detecting Oil Spills
There are a handful of methods for measuring oil in water. For large disasters such as the Deepwater Horizon spill, flow-rate estimations and calculations of spill area × spill thickness can provide a quantifiable range. But for the situations that we’re more likely to encounter, including smaller spills or detecting the presence of unknown oil, we need an in-situ approach. Learn how optical fluorescence and backscattering sensors can help detect and quantify oil spills.
Read More
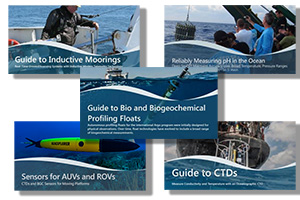
Sea-Bird Scientific Ebooks
Perhaps you agree: a day of reading Technical Papers can be draining. As we strive to deepen our knowledge, it’s important to return to the basic question – what are we actually trying to accomplish here? What does all this stuff actually do? So whether you’re planning your next research project or just looking to pass some time, check out our collection of Ebooks to learn how to harness the power of oceanographic sensors - minimal jargon guaranteed.
Read Here

Meet Our People: Erin Keen
Erin joined Sea-Bird Scientific in late October 2019. With a degree in oceanography, she comes from the National Ocean Service under NOAA where she worked in the field servicing water level stations. Today, she supports the Field Sales Team assisting with incoming product inquiries. Born and raised in the Seattle area, she enjoys hiking, kayaking, traveling, and writing/playing music.
Open Opportunities