The functionality on this page was blocked because content blocking is enabled.
Please use another browser to access the form. We recommend Google Chrome. [Learn More]
Doug Wilson, Carey Koch, Adam Dutton, Sam Bennett
May 25, 2017
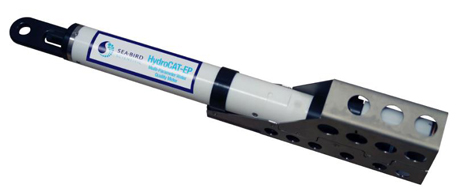
Figure 1: Sea-Bird Scientific HydroCAT-EP
The new Sea-Bird Scientific HydroCAT-EP incorporates a suite of physical and biogeochemical sensors into a single, robust instrument, designed to maximize water quality parameters and give sustained accuracy. The instrument uses the same high quality Sea-Bird and WET Labs sensors found on their industry leading CTDs and ocean systems in a robust, compact package designed for extended deployments in coastal environments. The HydroCAT-EP uses a closed, pumped flow path with anti-fouling infusion for Temperature, Conductivity, Dissolved Oxygen, and pH. Optical turbidity and chlorophyll sensors have a fully copper-protected window to keep biofouling virtually nil.
As part of HydroCAT-EP field tests, an extended deployment was carried out at Shilshole Bay, Puget Sound, Washington. In conjunction with the field tests, an SBE 37 MicroCAT with Dissolved Oxygen was deployed and a water sampling program was conducted. Intercomparisons between the data sets show the HydroCAT-EP is an accurate and stable instrument. These results also highlight the lack of maintenance required to sustain high quality data return. The HydroCAT-EP was deployed for 3.5 months from July 1, 2015 – October 15, 2015, during the biologically productive months with moderate to high biofouling conditions.
1. HydroCAT-EP Dissolved Oxygen Measurements
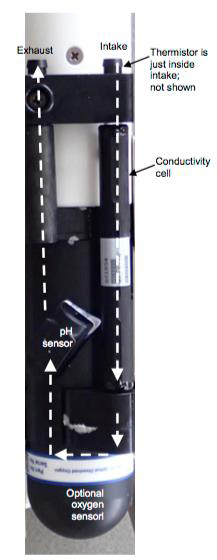
In the HydroCAT-EP, the optical SBE 63 DO sensor is in the flow path downstream of the temperature and conductivity sensors (Figure 2). Prior to a sample, the flow path is fully flushed and water is pumped through the sensor for the duration of the sample. By default, this is 7 times the 63% sensor time constant, or approximately 40 seconds.
Figure 2: HydroCAT-EP Flowpath
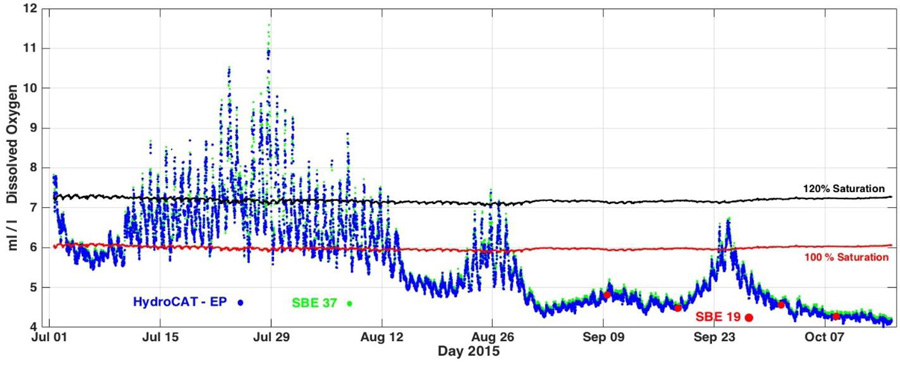
For the dissolved oxygen intercomparison, the HydroCAT-EP was moored alongside an SBE 37SMP MicroCAT with Pressure, Temperature, Conductivity, and Dissolved Oxygen. The SBE 37 mean depth was 2.5m; HydroCAT-EP was 2.8m. Figure 3 shows the 15-minute values of SBE 37 and HydroCAT-EP dissolved oxygen concentration in ml/l. The two optical dissolved oxygen sensors have the same mechanical and electrical construction; different calibration procedures give them slightly different accuracy specifications. The HydroCAT-EP dissolved oxygen sensor is calibrated to 200% saturation, with an initial accuracy of ± 0.14 ml/l; the SBE 37 is calibrated to 120% saturation, with an initial accuracy of ± 0.07 ml/l. The record includes times of significant diurnal photosynthetic activity and consequent dissolved oxygen saturations approaching 200%.
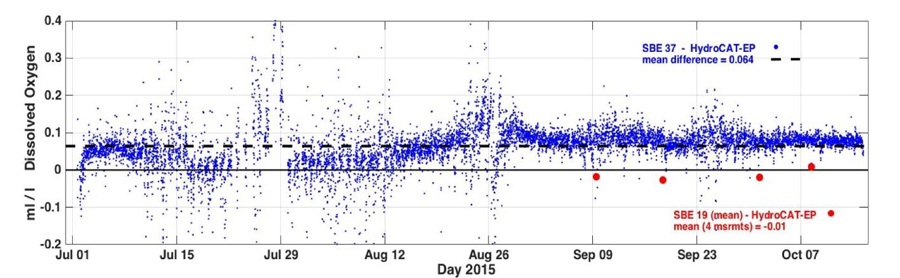
The difference between coincident SBE 37 and HydroCAT-EP values (excluding values >120% saturation) are shown in Figure 4. The mean difference was 0.064 ml/l with a standard deviation of ± 0.062 ml/l. Both values place the data well within the bounds of their combined accuracy specifications. The offset is consistent, having a linear drift of 0.002 ml/l over 106 day, and suggests a calibration difference rather than sensor drift.
A second comparison is made with four sets of measurements during the field test from an SBE 43 dissolved oxygen sensor deployed at the same depth as the HydroCAT-EP. The SBE 43, a membrane-type dissolved oxygen sensor, is deployed on an SBE 19plus V2 CTD and freshly calibrated before each comparison measurement to ensure the highest accuracy. HydroCAT-EP dissolved oxygen concentrations differed from the SBE 43 by less than 0.03 ml/l, with a mean difference of 0.01 ml/l. The results attest to the long-term accuracy and stability of the HydroCAT-EP, with dissolved oxygen concentrations drifting significantly less than the sensor initial accuracy over 3 months in a highly variable and productive environment.
Hourly values of dissolved oxygen in Shilshole Bay measured with aHydroCAT-EP (blue dots),an SBE 37 MicroCAT (green dots),and an SBE 43 deployed onanSBE 19plus V2 SeaCAT CTD (red circles).
Figure 4: Hourly values in Shilshole Bay of the difference between measured HydroCAT-EP and SBE 37 dissolved oxygen (bluedots), and HydroCAT-EP and SBE 43 dissolved oxygen (redcircles) deployed on anSBE 19plus V2 SeaCAT CTD
2. HydroCAT-EP pH Measurements
Figure 5: From the Shilshole Bay HydroCAT-EP: pH, dissolved oxygen concentration [ml/l],and dissolved oxygen saturation (ml/l, % saturation)
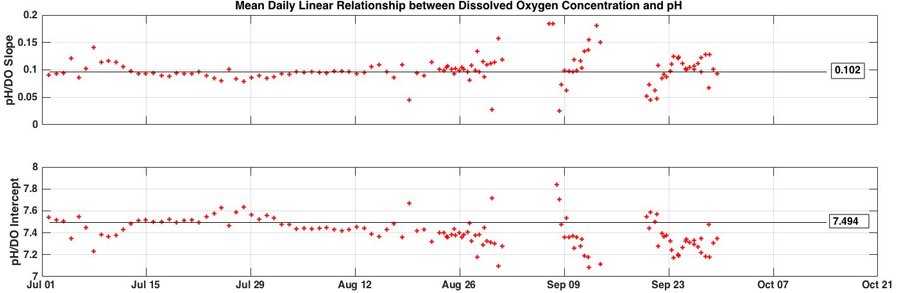
Figure 6: Linear Relationship between HydroCAT-EP dissolved oxygen and pH in Shilshole Bay
pH is a notoriously difficult measurement to make on a continuous, in situ basis. For the Shilshole Bay deployment, three concurrent pH probe measurements taken during the first 5 weeks showed a consistent mean difference of 0.04 pH units, well within the combined accuracy of the measurements.
Given an initial accuracy well within specifications, we have tried to address the question of longer term stability by utilizing the strong correlation between pH and dissolved oxygen concentration (Frieder et al. 2012), with extreme variations in both occurring during the Shilshole Bay deployment due to active photosynthesis / respiration (Figure 5). There is a linear relationship between dissolved oxygen concentration and pH within the saturation values (90 to 150 percent saturation), affected by phytoplanktonic photosynthesis/respiration variability. Since we have shown that dissolved oxygen accuracy has remained stable over the deployment, we can use the stability of the DO-pH relationship as an indicator of pH stability.
Slope and Intercept values in Figure 6 refer to the parameters of a linear fit between daily averages of dissolved oxygen and pH over the full deployment, using only DO saturation values between 90 and 150 %. Also shown are lines representing the mean slope and intercept values over the first 30 days. Recognizing that there may be other factors affecting the DO-pH relationship, the slopes and intercepts are quite stable over the first two months of the deployment. After August 26, the relationship is not as stable. Changes in the DO-pH relationship may be due to either pH sensor drift or biogeochemical changes in this dynamic near-shore environment.
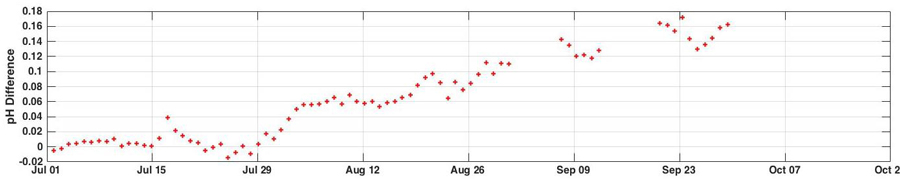
Still, using the daily mean dissolved oxygen, a daily mean theoretical pH can be calculated from the linear pH-DO relationship. The difference between the two values are shown in Figure 7 and are an estimate of the pH error. In this case, it shows an estimated drift of 0.1 pH over 2 months, slightly greater than the stated specification.
Figure 7:Difference between pH measured by the HydroCAT-EP and pH determined from the linear relationship between dissolved oxygen and pH
3. References
Frieder, C. A., S. H. Nam, T. R. Martz, and L. A. Levin. 2012. “High Temporal and Spatial Variability of Dissolved Oxygen and pH in a Nearshore California Kelp Forest.” Biogeosciences 9 (10): 3917–3930. doi:10.5194/bg-9-3917-2012.
![Figure 5: From the Shilshole Bay HydroCAT-EP: pH, dissolved oxygen concentration [ml/l],and dissolved oxygen saturation (ml/l, % saturation)](/mdf_cb16b20c2457c3c1f2abfd07cb2fba4459/en/seabird_com/cms/images/dissolved-oxygen-concentration-900x305.jpg)