- PRODUCTS
- MODEL LIST
- APPLICATIONS
- SUPPORT
- SALES/SERVICE
- BLOG
- ABOUT
Login
Configuring a SUNA V2 for Real-Time Analog Output
The functionality on this page was blocked because content blocking is enabled.
Please use another browser to access the form. We recommend Google Chrome. [Learn More]
For use with a Sea-Bird Scientific Profiling CTD
Greg Ikeda
August 2018
Introduction
The SUNA V2 UV Nitrate Sensor has multiple data output options: RS-232, SDI-12, and analog output. If equipped with the analog output option, it can output an analog current or voltage signal that is representative of the nitrate concentration. The analog output is an optional factory-enabled feature; SUNA V2s that lack this feature must be sent back to Sea-Bird Scientific for modification. When enabled, this feature allows the user to integrate the SUNA V2 with any data logger or CTD that can accept analog data. This is similar to integrating a standard auxiliary sensor (such as the SBE 43 Dissolved Oxygen Sensor) with a CTD.
This capability is especially useful for integrating the SUNA V2 with the current line of Sea-Bird Scientific profiling CTDs, which are unable to optimally handle the SUNA V2’s RS-232 output in real-time:
- The SBE 19plusV2 is unable to accept serial data from the SUNA V2; it is limited to a specific selection of RS-232 sensors.
- The SBE 25plus can log data from an RS-232 sensor to its internal memory, but it cannot output serial data in real-time.
- The SBE 9plus requires the “Serial Data Uplink” modification to output data from an RS-232 sensor in real time, and it does not append SUNA data inline with CTD data.
Despite limitations in handling RS-232 data from auxiliary sensors, all Sea-Bird profiling CTDs come equipped with “Voltage Channels” that can accept and analog voltage signal within 0-5 V. Configuring the SUNA V2 to output analog voltage data bypasses he RS-232 limitations, allowing for real-time nitrate data on any profiling CTD platform.
Calculating Nitrate from Voltage
When equipped with the analog output option, the SUNA V2 scales the analog voltage output to the measured nitrate concentration based on a digital-analog converter:
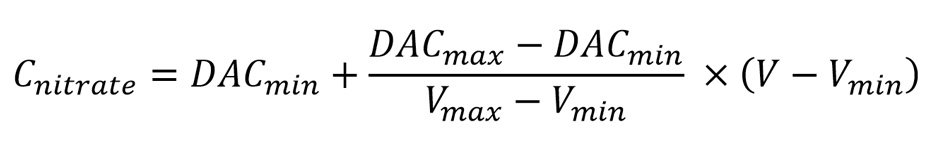
Where
- Cnitrate is the final nitrate concentration, as calculated from the analog voltage output.
- DACmin is the nitrate concentration at the minimum voltage.
- DACmax is the nitrate concentration at the maximum voltage.
- Vmin is the minimum voltage. Nominally 0.095 V.
- Vmax is the maximum voltage. Nominally 4.095 V.
- V is the generated voltage, output by the SUNA V2 and received by the CTD.
The Vmin and Vmax coefficients are dependent on the particular SUNA V2, as well as the cable and CTD to a lesser extent. For optimal accuracy, calculate these coefficients prior to deployment, especially when integrating the SUNA V2 with a new CTD. When these coefficients are available, nitrate concentration (Cnitrate) scales directly with V, the voltage output from the SUNA V2 and logged by the CTD.
Calculating Coefficients
Calculating two sets of coefficients are crucial for optimal accuracy and resolution:
- Obtaining an accurate voltage for V>min and Vmax
- Fine tuning the DAC min/max settings to optimize resolution
These coefficients are specific to the system (SUNA V2, cable, and CTD) and the deployment environment. Proper calculation of these coefficients is crucial for obtaining accuracy and resolution from the analog output.
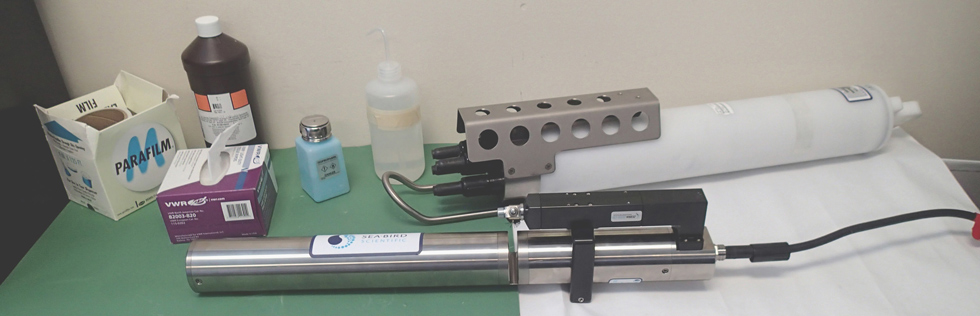
Required Materials:
- SUNA V2
- Deployment CTD
- Deployment Cable
- DI Water
- Nitrate Standard (higher than 15 μM)
- Parafilm or plastic wrap
Establishing the Voltage Range (Vmin and Vmax)
The voltage output is generated using a precision 12-bit digital-to-analog converter (DAC) with a nominal range of 0.095 to 4.095 Volts. In a deployed system, voltage and current differ slightly due to transmission losses. To optimize accuracy, obtain a more accurate voltage range for the specific SUNA V2, cable, and CTD.

-
-
- Connect the SUNA V2 to UCI
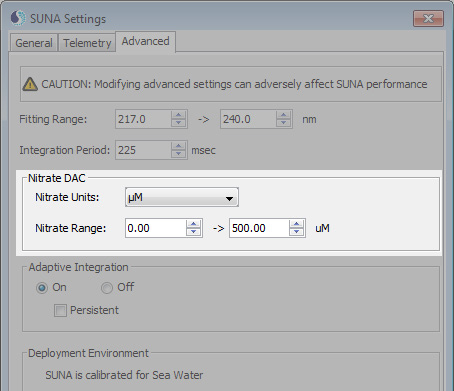
- Navigate to SUNA Settings → “Advanced” tab
- Set the Nitrate DAC range to 0 μM → 15 μM. This will provide the zero voltage at 0 μM and the highest voltage at 15 μM
- Upload the settings
- Connect the SUNA V2 to the CTD. Use the cable that will be used for the deployment.
- Ensure the SUNA V2’s windows are clean and fill the optical path with DI water as though performing a Reference Update (see the SUNA V2 manual for more information).
- Power the system and command the CTD to read the voltage from the SUNA V2.
- 19plusV2: Send the “TV” command to read the voltage on every analog voltage channel. Note the voltage in the column that corresponds with the SUNA V2’s voltage channel.
- 25plus: Send the “TSV” command to read the voltage on every analog voltage channel. Note the voltage in the column that corresponds with the SUNA V2’s voltage channel. Alternatively, you can use the “GetVAux#” command, where # corresponds with the connector number that the SUNA is connected to (GetVAux2 will measure voltage on J2, which contains voltage channels 4 and 5)
- 9plus: Connect the system to SeaSave and add the voltage channel connected to the SUNA V2 to a “Scrolled Display window” (Display→Add New Scrolled Display Window). The voltage from the SUNA V2 will appear in this display once real-time acquisition starts.
-
NOTE: Sea-Bird highly recommends using an external battery for the SUNA V2 due to high current draw.
-
-
- Record this as the low voltage, “Vmin”
- Remove the DI water, and fill the flow path with a high-nitrate standard. This must be higher than 15 μM to max out the signal.
- Repeat step 7 to capture the voltage again. Log the voltage as “Vmax”.
-
Adjusting the DAC Range For the Expected Nitrate Range
The SUNA V2 automatically scales the voltage output to the nitrate range encompassed by DACmin and DACmax. After obtaining the Vmin and Vmax, adjust the DACmin and DACmax to the expected nitrate range of the deployment environment for optimal resolution.
If the maximum range of nitrate in the deployment environment is completely unknown and cannot be estimated, use the 2000 μM maximum detection range of the SUNA V2 until the nitrate range can be established. This reduces resolution but ensures the full range of nitrate is sampled. For SUNA V2s with the optional 2 GB memory, users can upload high-resolution data after the deployment.
Example: How the DAC Range Affects Resolution
A 0.5 V change for a SUNA V2 with the DACmin and DACmax range scaled to 100 μM will correspond roughly with a 10.125 μM change in nitrate:

A 0.5 V change for a SUNA V2 with the DACmin and DACmax range scaled to 1000 μM will correspond roughly with a 125 μM change in nitrate:

-
-
- Reconnect the SUNA V2 to UCI.
- Navigate to SUNA Settings → Advanced
- Set the DAC minimum value to 0, and the DAC maximum value to your expected maximum.
- Upload the settings to the SUNA V2. The maximum concentration in μM will now correspond with the maximum voltage Vmax.
-
WARNING: Scaling DACmax too low will prevent the SUNA V2 from sampling the full nitrate range. An extremely low DACmax may cause the SUNA V2 to output maximum voltage upon entering seawater.
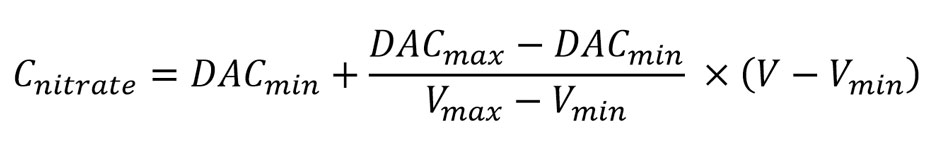
Processing Data
Once the Voltage and DAC ranges are established, the voltage output from the SUNA V2 to the CTD should reflect accurate nitrate concentrations. The user can then convert these voltages to nitrate in real-time with the formula below:
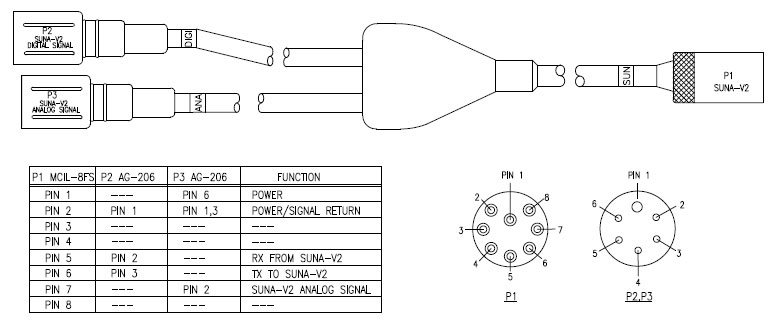
25plus Dual Serial/Analog cable
Sea-Bird Scientific offers a Y-cable (PN 173402) designed to simultaneously connect the SUNA V2 analog output to a voltage channel and the RS-232 output to one of the 25plus serial input channels.
This cable is useful for applications that benefit from lower resolution real-time data, but need to retain the high resolution data for post-processing. For instance, the CTD operator can determine areas of interest for water sampling with the real-time analog data, then compare the water samples to the high-resolution data from the serial output after the profile.