- PRODUCTS
- MODEL LIST
- APPLICATIONS
- SUPPORT
- SALES/SERVICE
- BLOG
- ABOUT
Measuring Nitrate in Puget Sound Using Optical Sensors
The functionality on this page was blocked because content blocking is enabled.
Please use another browser to access the form. We recommend Google Chrome. [Learn More]
Calibration and Correction Strategies for Obtaining Accurate Data
Kim I. Martini, Charles W. Branham, Stephanie A. Jaeger, Ian D. Walsh, Laura Collins, Dave J. Murphy
Introduction
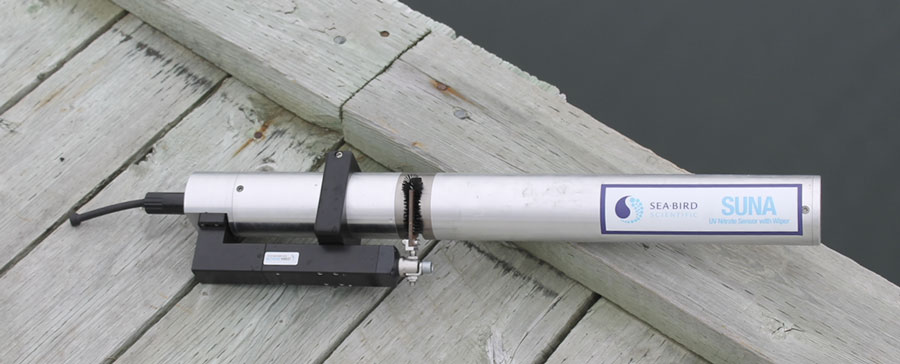
The promise of ‘chemical free’ chemistry is the oxymoron that you think it is. But the development of a ‘wet chemistry free’ sensor for determining nitrate concentrations in sea-water by Ken Johnson and Luke Coletti [1] gave the oceanographic community a tool that has turned into a robust and cost-effective way to measure one of the primary nutrients. Now licensed and marketed by Sea-Bird Scientific, the UV absorption deconvolution method is the technology behind the SUNA Optical Nitrate Sensor, allowing researchers and managers to get reliable nitrate concentration measurements without the limitations of traditional wet chemistry.
The advantage of measuring a dissolved species using absorption over wet chemistry is manifest in two major ways: no need to handle a sample, and no need to prepare, store, and deliver reagents. Just as photographic film has given way to digital imaging, ease of use tends to overcome differences in fidelity or accuracy between older and newer technology. In the case of digital photography, the explosion of the ‘selfie’ was enabled by the ease of taking, transmitting and disseminating the image. With the SUNA, the effort required to learn and assemble the needed sample processing has crumbled away with the ability to measure nitrate at the same time and resolution as other parameters.
However, while the SUNA instrument itself is an elegant tool, there is a host of factors that must be considered to measure nitrate concentrations with the accuracy and precision approaching that of the wet chemistry technique. There are always trade-offs, and though the SUNA returns more rapid data delivery over longer time periods than wet chemistry, the user needs to understand the framework of the measurement to understand how to interpret the data, and most importantly the limitations of the technique.
In this article we describe SUNA technology, optical nitrate theory, SUNA calibration by Sea-Bird Scientific, and examples of data collection and validation techniques. Our intent is to highlight that while the measurement is robust, the optical technique requires a dutiful effort by the user to eliminate interference for delivering the best data.
SUNA Technology
The SUNA uses the optical absorbance characteristics of nitrate to calculate concentration by measuring the response of nitrate to excitation by UV light across a range of wavelengths. A deuterium lamp illuminates the sample volume with UV light. The water in the illuminated sample volume absorbs a variable fraction of the photons it. Then the intensity of light passing through the volume is measured with a spectrometer. The ratio of the light entering the volume and detected by the spectrophotometer yields the wavelength specific absorbance. These absorbance spectra across a range of wavelength channels are used to calculate the dissolved nitrate concentration, which is reported in micromoles per liter (μM) or milligrams of nitrogen per liter.
Calculating Nitrate Concentration
The former explanation vastly simplifies the conversion from optical absorbance to nitrate concentration. Optical absorbance is additive (the Beer-Lambert Law), and the presence of other absorbing species in seawater interferes with the nitrate measurement. In other words, the absorbance measured by the SUNA is the sum of the absorbance of nitrate, seawater and any additional material found in the sample volume. In SUNA calibration and processing, the effects of interfering species on measured absorbance spectra are considered to accurately determine nitrate concentrations.
The absorbance in each wavelength channel is determined from the measured light intensity of the in situ sample and a reference deionized water sample measured in the laboratory. For each spectrometer wavelength channel, the absorbance is calculated as
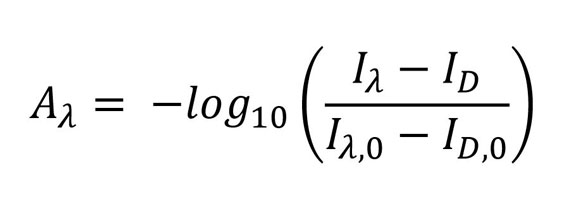
where Iλ is the specific intensity, ID the dark intensity, Iλ,0 the intensity of reference deionized water and ID,0 the dark intensity of reference deionized water. Dark intensities are a zero-point calibration measured with the light source turned off. Even at zero light, the spectrometer intensity is not zero due to intrinsic properties of the circuit. By measuring the zero-point and subtracting it, the intensity of the amount of light incident on the sensor is determined.
In the wavelength range resolved by the SUNA spectrometer; bromide, nitrite and bisulfide are compounds commonly found in seawater having quantifiable absorbance spectra that overlap with nitrate. Laboratory calibrations performed at Sea-Bird are used to remove the baseline absorbance spectra. To differentiate nitrate from overlapping absorbance spectra, only the 35 spectrometer channels spanning the 217-240 nm wavelength range are used to estimate nitrate concentration. This narrow band is chosen to minimize the effects of bromide and bisulfide whose peaks fall outside this range. The nitrite absorbance spectrum is similar to nitrate and fall within this range, but nitrite concentrations in seawater are typically smaller than the accuracy of the SUNA. The impact of nitrite on the nitrate absorbance spectrum is therefore treated as negligible.
After the absorbance spectrum for nitrate is determined, nitrate concentrations can then be calculated. The absorbance spectrum is fit to a model using multivariate linear regression, from which molar nitrate is calculated and can then be converted to a nitrate concentration [2].
Freshwater/Saltwater Calibrations and Use
To remove baseline water absorbance spectra, SUNAs are calibrated with nitrate-spiked water, as well as nitrate-free water. The default class-based calibration uses coefficients generated from a library of historical calibrations. For greater accuracy, SUNA sensors are individually calibrated at Sea-Bird Scientific for use in fresh or seawater. Due to difference in absorptivity characteristics of seawater and freshwater, the calibration data for each of these applications is distinct.
Calibrations for instruments to be used in freshwater are determined from aqueous nitrate standards of deionized water with 40 and 4000 μmolar nitrate concentrations and pure deionized water. The second calibration at 4000 μmolar is performed for accuracy in terrestrial applications where nitrate concentrations are large. It is important to note that SUNA units configured for use in freshwater do not give reliable nitrate readings in seawater, as the interference from bromide will not be accounted for without seawater absorption data.
Instruments calibrated for use in seawater use nitrate standards of seawater with 40 μmolar nitrate concentrations and nitrate-free seawater to determine the baseline seawater absorbance spectrum. The use of seawater enables the correction for the UV absorption of bromide and other sea salt components. Instruments calibrated for use in seawater can be used in freshwater applications, but the accuracy will be decreased in regions of high nitrate concentration because the instrument is calibrated for the smaller range of nitrate concentrations typically found in seawater.
Precision and accuracy
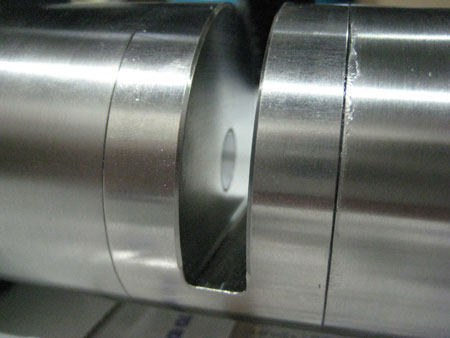
Figure 1: The 10mm path length, corresponding to the 10 mm gap between the SUNA V2’s lamp and spectrometer windows.
SUNA accuracy for instruments with a 10 mm length is 10% of the reading or 2 μM when 10% is less than 2 μM for instruments. For instruments with a 5 mm path length designed for use in turbid conditions, accuracy is 10% of the reading or 4 μM when 10% is less than 4 μM. However, this accuracy is dependent on data fidelity and corrections that are applied.
The precision of the nitrate sensors is 0.3 μM in freshwater and in seawater with the T-S correction applied, 2.4 μM in seawater without the T-S correction. Precision is determined by how much light from the source is returned to the sensor and the number of
wavelength channels that are resolved. Operation in optically dense or turbid water can reduce optical transmission, reducing the strength of the signal. To compensate the SUNA has adaptive sampling capabilities, varying the length of time over which each measurement is made. Integration times vary from 200-500 ms, increasing in turbid and optically poor conditions. On the other hand, absorbance greater than 1.3 in a wavelength channel can significantly bias the regression and is therefore not used in processing. If less than 10 wavelength channels are available, the multivariate regression cannot be performed and nitrate concentration is not calculated. Biofilms and window scratching can also alter light transmission to the sensor. The source of this error can be prevented by keeping the optics clean and using the optional Hydro-Wiper external antifouling.
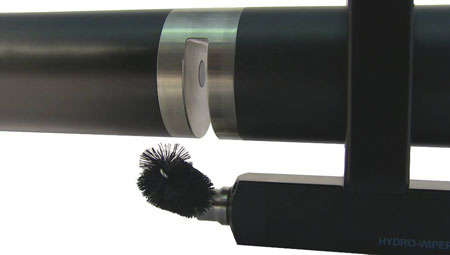
Figure 2: The Hydro-Wiper attachment on a SUNA V2. Deploying with the window opening facing dowards helps prevent sediment accumulation.
Light source aging causes sensor drift as the intensity of the light emitted from the light source decreases with time. This can be corrected by the user by regularly updating the spectrum of reference deionized water. Instructions for updating the reference spectrum and the calibration file are provided in the SUNA manual.
Interference with overlapping absorption spectra from other materials in the light path affects sensor accuracy. Bromide, nitrite, bisulfide, CDOM and suspended particulates have absorbance spectra similar to nitrate and if not removed, nitrate concentrations are biased. This was found in early field testing of the SUNA nitrate sensor and its technological predecessors, where the temperature dependence of bromide absorbance in seawater caused a bias. This bias is corrected by changing the baseline seawater absorbance spectrum using in situ seawater temperature and salinity [3]. The baseline seawater absorbance spectra are corrected, then subtracted from the measured absorbance before using multivariate linear regression to determine nitrate concentration. Gathering robust CTD measurements concurrently with SUNA nitrate measurements allows the application of the seawater correction in postprocessing using Sea-Bird UCI software, or in situ when properly interfaced as on ARGO floats.
Colored Dissolved Organic Matter (CDOM) and particulate suspended matter (turbidity) affect accuracy because they absorb at all wavelengths and therefore have absorbance spectra that overlap nitrate. CDOM and turbidity spectra cannot be parameterized with independent measurement, such as the seawater correction, as there is no universal model for their concentration and composition. To correct for CDOM and turbidity, the absorbance spectra can be characterized at the deployment site, then subtracted from the measured absorbance spectra in post-processing as described in Johnson and Coletti et al. [1]. Typically, this correction only needs to be applied in regions with high sediment loads or phytoplankton blooms.
Field validation case study
The King County Dept. of Natural Resources and Parks (in Seattle, WA USA) conducts long-term marine monitoring to assess baseline conditions and trends in Central Puget Sound. Routine nutrient data, including nitrate, have been collected since 1994. Twice monthly observations are collected at several marine stations in Puget Sound (Figure 3), using a suite of biogeochemical sensors while concurrently collecting discrete water samples at multiple depths. This example enables the direct comparison of nitrate concentrations made with the SUNA nitrate to those made with traditional wet chemistry methods.
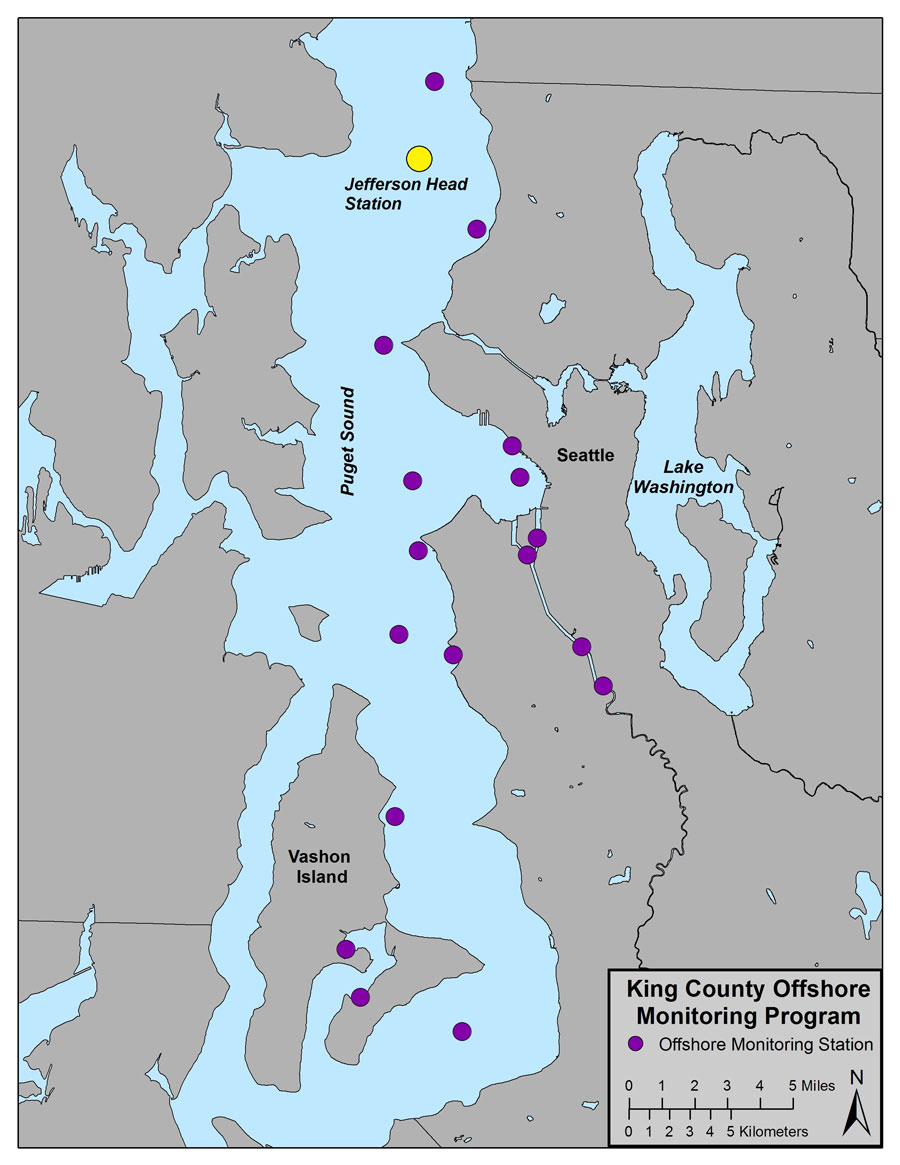
A shipboard profiling carousel is the primary monitoring tool, outfitted with sensors to measure temperature, salinity, depth, dissolved oxygen, transmissivity, fluorescence, and nitrate. Five water sampling bottles mounted on the carousel are used to collect discrete measurements of bacteria levels (Fecal coliform indicators and Enterococcus), nutrient levels (dissolved inorganic nitrogen, total nitrogen, orthophosphate, and silica), pigment levels (Chlorophyll-a and Pheophytin-a), and physical parameters (dissolved oxygen, salinity, and total dissolved solids). This paper focuses on the SUNA nitrate sensor and discrete samples of nitrate + nitrite nitrogen collected at Jefferson Head Station (the yellow circle on Figure 3) on April 4th 2017. For information about the other sensors or to access the data, please visit the King County Marine Monitoring Group’s webpage: http://green2.kingcounty.gov/marine/
The SUNA V2 is configured with a 10mm path length and is controlled by a Sea-Bird 25plus CTD (Conductivity, Temperature and Depth). The CTD collects measurements in real-time during the downcast and upcast and triggers the acquisition of discrete water samples by closing the sampling bottles at specific depths during the upcast. These bottle samples are then used to measure the nitrate concentration in the water using a colorimetric analysis method (NEMI METHOD, SM4500-NO3-F). The SUNA V2 nitrate sensor was calibrated with nitrate spiked seawater at Sea-Bird Scientific’s state of the art sensor development labs. Absorbance spectra were corrected for seawater bromide using in situ temperature and salinity data following Sakamoto et al. [3].
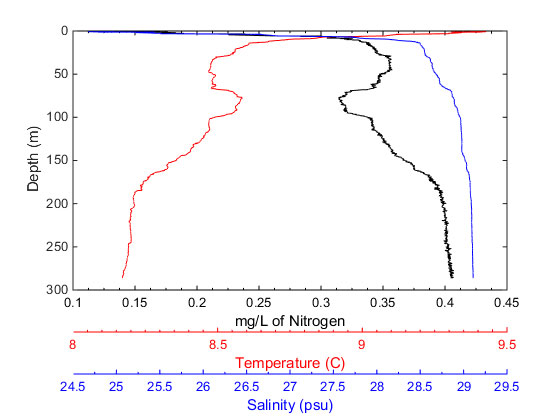
Figure 4: Vertical profile (downcast) of temperature (red), salinity (blue), and nitrate concentration (black) in the water column at Jefferson Head Station on April 4th, 2017.
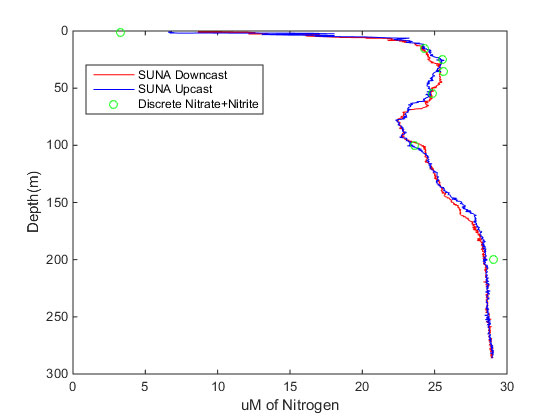
Figure 4 shows the vertical profile of the water column at the Jefferson Head station and the relationship between temperature (red line), salinity (blue line) and nitrate concentration (black line) versus depth. In the upper water column (<30 m), the nitrate concentration is very low because it is rapidly consumed by phytoplankton which are fueled by the penetration of the sun rays into the seawater. Below this, the nitrate concentration is larger because upwelling replenishes nutrient concentrations from deeper, nitrate-rich water. Figure 5 shows the SUNA V2 nitrate data from the upcast (blue circle) and downcast (red circle) along with the in situ discrete nitrate bottle samples (green star). Differences between the upcast and the downcast can be attributed to vertical movement of water. The reproducibility of the sensor is demonstrated by the negligible hysteresis between the upcast and downcast. The SUNA V2 nitrate sensor accuracy was also excellent, to within ±0.18 μM of nitrate when compared to discrete bottle samples taken from 20-300m depth (the accuracy specification of a 10mm cell SUNA V2 with T and S correction is ±2 μM). Nitrite is included in the bottle samples and can contribute from 0-2.2 μM of the total nitrate+nitrite. The 1m bottle sample had poor agreement with the reported value from the SUNA V2 nitrate sensor (Δ3.5 μM from bottle sample). This could either be due to high variability in the surface layer, as the SUNA and the bottle samples are not collocated.
Conclusion
With the appropriate calibrations and corrections, the SUNA nitrate sensor is a robust tool to measure nitrate concentrations in oceanic and freshwater environments. In this case study, SUNA measurements from Puget Sound corrected for bromide match the accuracy of measurements made with traditional wet chemistry techniques to within ±0.18 μM. While care must be taken when processing SUNA data, updates to the reference spectrum and seawater corrections can be applied by the user with Sea-Bird Scientific’s UCI graphical data processing software if concurrent temperature and salinity measurements are available. These corrections help SUNA measurements made in seawater approach those made with discrete measurements while retaining the high vertical resolution of optical based chemical sensors. Scientists and engineers at Sea-Bird Scientific continue to refine SUNA technology, calibrations and processing to minimize sensor drift and interference from other chemical species for greater accuracy and precision in a wider range of environments.
References
[1] K. S. Johnson and L. J. Coletti, “In situ ultraviolet spectrophotometry for high resolution and long-term monitoring of nitrate, bromide and bisulfide in the ocean,” Deep Sea Res. Part Oceanogr. Res. Pap., vol. 49, no. 7, pp. 1291–1305, 2002.
[2] K. Johnson et al., “Processing Bio-Argo nitrate concentration at the DAC Level,” 2016.
[3] “Improved algorithm for the computation of nitrate concentrations in seawater using an in situ ultraviolet spectrophotometer - Sakamoto - 2009 - Limnology and Oceanography: Methods - Wiley Online Library.” [Online]. Available: http://onlinelibrary.wiley.com/doi/10.4319/lom.2009.7.132/full. [Accessed: 07-Aug-2017].

