.svg)

The salinity profile shown above was from an arctic deployment in rough seas. At a certain point, we see regular salinity spikes of about ± .01 psu in the upcast data.
What’s unusual is the regularity and size of each spike – electrical issues may manifest with a consistent pattern, but we’d typically expect those to show extreme errors in data. Can you determine what caused this?
Answer: Sampling Errors from Ship Heave
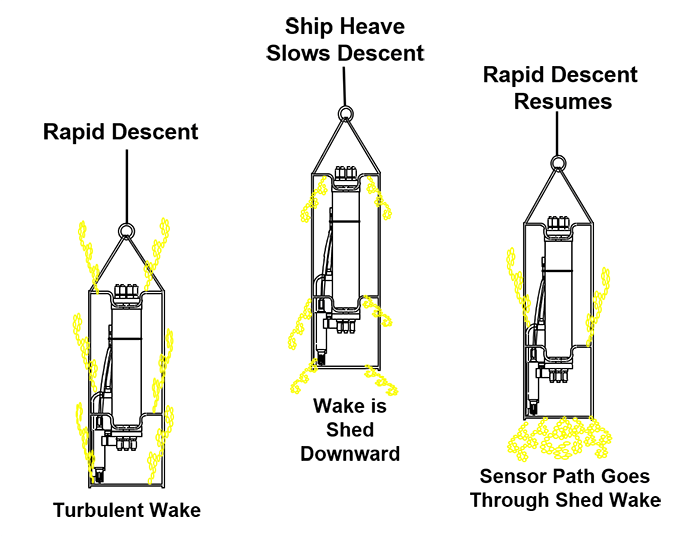
“Ship heave” is the rocking motion of the vessel, often the result of rough seas. For a CTD deployed from a sea cable, this rocking motion leads to pulling and slackening of the sea cable when the ship rocks in each direction. The resulting pull/slack causes deceleration/acceleration of the underwater package. As the instrument decelerates, it entrains water within the package that can continue downward past the sensors. This water is of different temperature and conductivity than the water at the bottom of the package, and it causes a sampling error.
You can see this in action by plotting “Descent Rate” (meters depth per second) alongside salinity. Note how the spikes in salinity correspond to “loops” in descent rate. In calm waters, descent rate is typically consistent at around 1-2 meters/second. But descent rate varies in rough seas. In extreme conditions, the pull on the sea cable can actually cause the CTD to ascend during the descent, resulting in a “loop”
[caption id="attachment_2050" align="aligncenter" width="1000"] The same profile showing salinity next to descent rate. Several salinity spikes correspond with dense sections of descent rate (left) indicating rapid motion of the underwater package at these moments. Zooming in on a single spike shows a corresponding loop in the descent rate (right).[/caption]
With most winch / A-frame hardware, these sampling errors are unavoidable. Knowing how to recognize them is crucial.