.svg)

Kim Martini

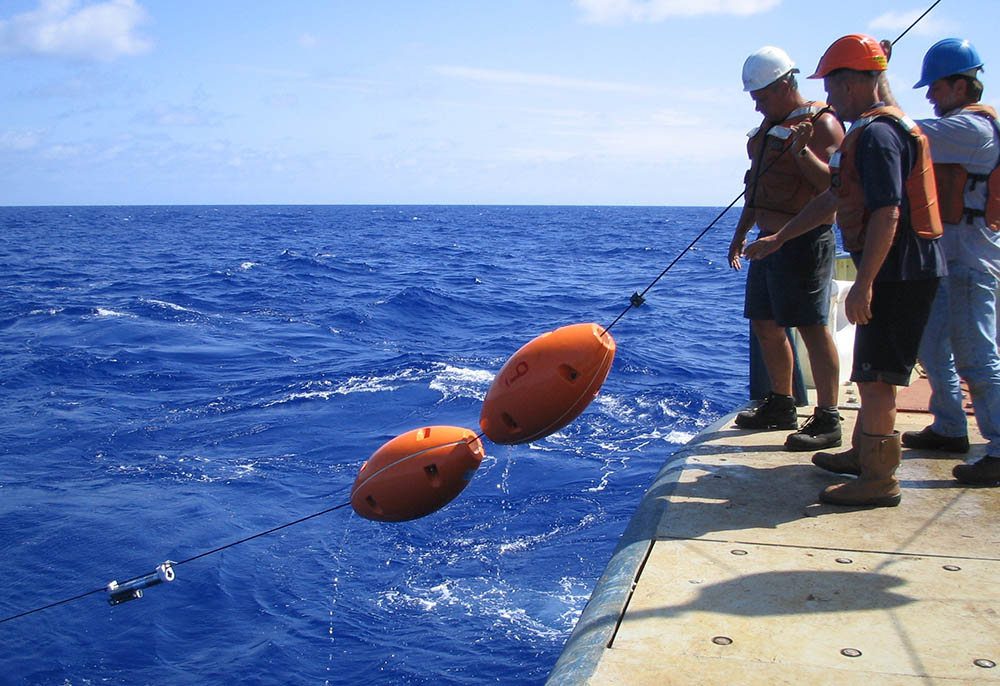
Figure 1: Picture of the Sea-Sciences Acrobat on deck before deployment. The SBE 49 FastCAT CTD and ECO Puck are mounted horizontally in the reinforced sled underneath the wings and main body.
Biophysical processes in the upper ocean are complex. Disentangling the myriad of factors that affects them requires measurements of multiple biological and physical properties across a wide range of temporal and spatial scales. Here we present data from a study by Martini et al. [2016] that uses a suite of sensors to determine the physical controls on subsurface phytoplankton concentrations in the Chukchi Sea. By integrating an SBE 49 FastCAT CTD and ECO Puck onto a towed vehicle, high-resolution physical and biological maps of the upper ocean were made. These instruments were chosen for their high sampling frequency, compact size and ability to transit the data back in real-time, enabling adaptive sampling and the resolution of thin and patchy biological and physical properties.
The Sea-Sciences Acrobat is a modular, winged instrument platform with a fully-customizable instrument payload. This platform profiles the upper ocean from 0-80 m while being towed behind a ship at speeds between 3-10 knots. While being towed, the Acrobat can reach vertical speeds

as high as 1 m/s. High sampling frequencies are therefore crucial to ensure the resolution of the thin, subsurface biological and physical layers found in the Chukchi Sea.
The Sea-Bird Scientific FastCAT CTD measures pressure, conductivity and temperature at 16 Hz. In the summertime, the Chukchi Sea is a two-layer system: warm, fresh meltwater formed by ice melting at the surface overlies cold, salty winter water formed during freeze-up. At the interface between these two layers, temperature and practical salinity can change as much as 5 ºC and 3 PSU over 2 meters. With dynamic corrections determined specifically for the Acrobat platform, these thin layers could be resolved to within an accuracy of 0.5 meters. These corrections are described in more detail in Martini et al. [2016].
The Sea-Bird Scientific ECO Puck contained 2 fluorescence and 1 backscatter channel to estimate chlorophyll-a, colored dissolved organic matter (CDOM) and turbidity. The ECO Puck was set to sample at the highest frequency of 8 Hz, then binned onto a 0.5-meter vertical grid in post-processing.
2. The subsurface chlorophyll maxima
Over the course of two weeks in September 2012, the Acrobat made over 5000 profiles along the 1600 km ship track. The average distance between each profile was 300 m, providing an unprecedented view of the horizontal structure of water masses and phytoplankton in the Chukchi Sea (Figure 2). The upper melt-water and lower winter water layers and the interface between them can be tracked as it changes going northward. There is a clear horizontal front between colder and warmer surface water masses at 71.4 N. Thin patches of subsurface chlorophyll are evident in the lower layer. High particle concentrations in the lower layer are likely caused by bottom mixing.

The vertical and horizontal data is fine enough, for the first time, to estimate both the thickness and size of subsurface phytoplankton patches and refine estimates of the total biomass contained in the subsurface. Additionally, the size of the patches is dependent on which water mass they reside in. Although the study was augmented with traditional shipboard data and water samples, these results were only possible by combining the physical data from the FastCAT with the optical data from the ECO Puck.
3. Additional applications
Integration of the FastCAT CTD and the ECO Puck onto a common sampling platform enables coincident sampling of physical and optical properties up to depths of 600 m, ideal for upper ocean and coastal environments. For example, the system can be used for mapping coastal regions where environmental conditions can change rapidly. Real-time data streams can be used for adaptive sampling to resolve temporally and spatially evolving bio-physical processes or physical data can be used in conjunction with bathymetric surveys to estimate sound speed in shallow, estuarine environments. Because of their compact size and modular design, the FastCAT CTD and ECO Puck can be deployed from smaller platforms, making it possible to conduct high-resolution surveys in otherwise challenging environments.
4. References
Martini, Kim I., Phyllis J. Stabeno, Carol Ladd, Peter Winsor, Tom J. Weingartner, Calvin W. Mordy, and Lisa B. Eisner. 2016. “Dependence of Subsurface Chlorophyll on Seasonal Water Masses in the Chukchi Sea.” Journal of Geophysical Research: Oceans.
Data courtesy of Peter Winsor and the ART Lab (http://www.ims.uaf.edu/artlab/) at the University of Alaska Fairbanks and Phyllis Stabeno, Calvin Mordy and Lisa Eisner from the EcoFOCI group at NOAA Pacific Marine Environmental Laboratory.