.svg)

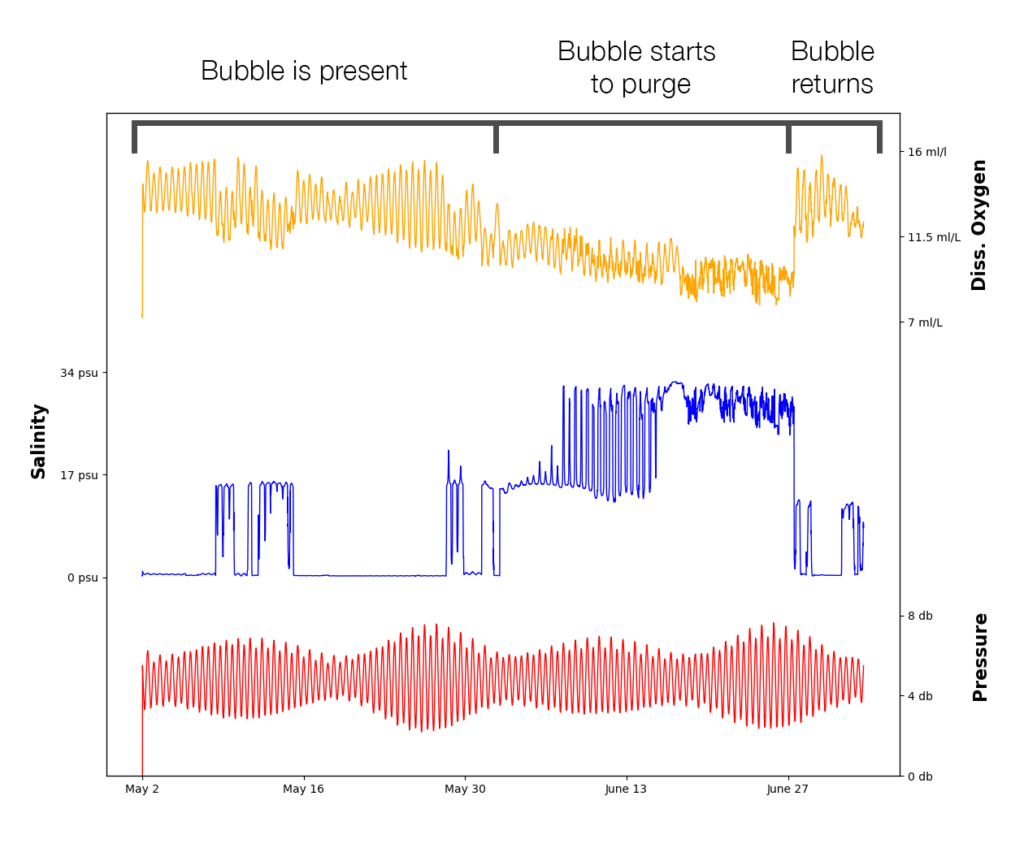
There’s a lot to unpack here – salinity is either 0 psu or highly erratic for most of the deployment, and dissolved oxygen shows an unrealistically smooth pattern when compared to a nearby CTD. Zooming in on just a few days shows that both salinity and dissolved oxygen are fluctuating heavily alongside the tidal cycle. Can you determine what is causing this unusual data?
Hint: Dissolved oxygen and salinity both benefit from consistent flow, even with moored CTDs like this one.
There were actually a few of problems with this deployment:
- The CTD had sediment and biofouling in the flow path leftover from the previous deployment. This impeded proper flushing immediately after the CTD entered the water.
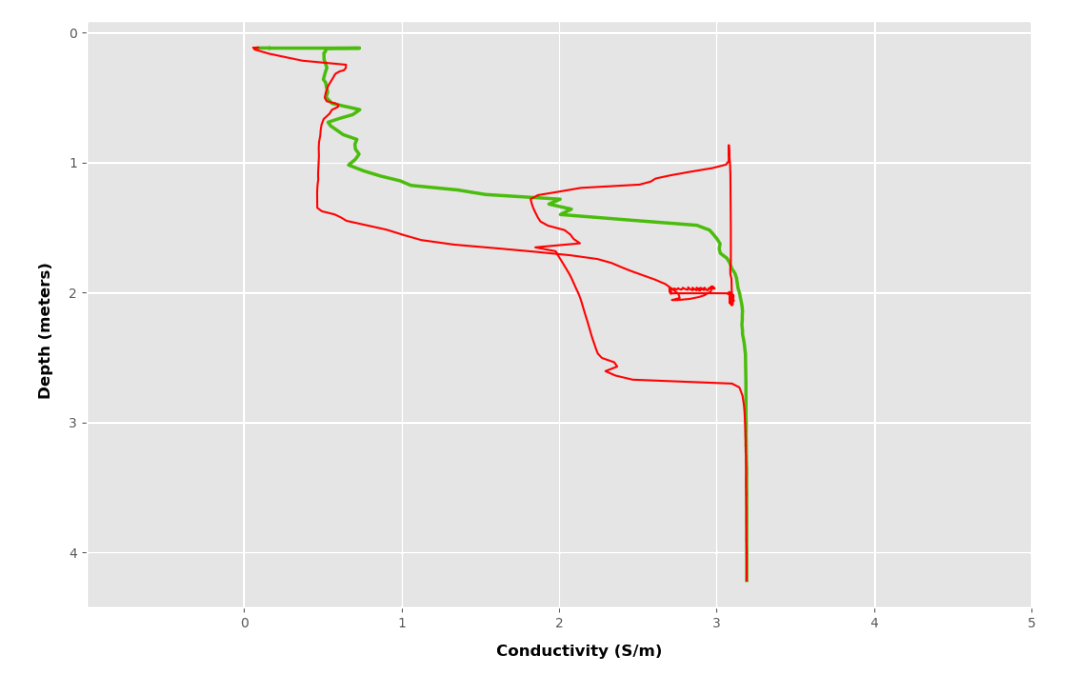
- Bubbles were caught in the flow path, likely due to preexisting fouling. When an electrode in the conductivity cell is encased in a bubble, conductivity measurements will drop to zero. When bubbles are trapped near the dissolved oxygen sensor, it is common to see a pattern that follows the tidal cycle; increasing/decreasing pressure causes the bubbles to expand and contract, which is picked up by the sensor.
- The CTD was deployed in a way that allowed for fine sediment to collect in the flow path.
Naturally, cleaning the instrument prior to deployment (ideally after recovery) is the first step. Any biofouling and sediment buildup leftover from a previous deployment can prevent bubbles from properly escaping when the CTD enters the water.
With that preexisting fouling, bubbles in the flow path may never have been able to escape. This is especially true at shallow depths, where low surface pressure doesn’t squeeze bubbles out of the plumbing as effectively. Shaking the instrument underwater to purge the initial bubbles can prevent this altogether, even when deploying a clean instrument.
For sediment buildup, deploying the CTD with the conductivity cell up and connector down will allow sediment to escape, and will prevent it from gathering near the SBE 63 dissolved oxygen sensor.