.svg)

Q&A: Diagnosing Salinity Spikes

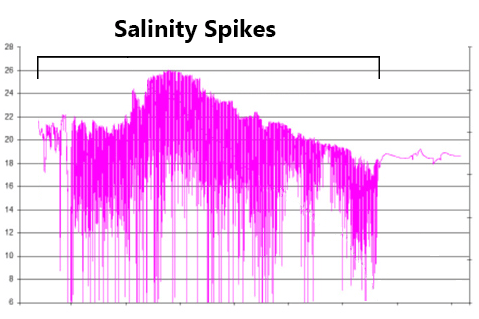
The figure above shows a time series of salinity from a moored CTD. For most of the deployment, salinity showed frequent downward spikes, dropping from an expected range of 18-26 psu to near zero. Can you determine the cause?
Persistent Bubbles in Conductivity Cell

This CTD’s flow path had bubbles that were not flushed from the flow path. These cause data spikes that can look similar to electrical noise if large air bubbles are present in the plumbing. There are a few tells that help differentiate bubble spikes from hardware issues:
- Bubble spikes will always be downwards, towards low conductivity.
- Bubble spikes often disappear at higher pressures or when the pump kicks in, as these help to purge bubbles from the flow path.
- Bubbles may be more common for CTDs deployed near the surface; wave action or low tide may introduce new bubbles to the flow path.
Bubbles in the conductivity cell can result when the flow path is clogged or if the CTD has not been properly deployed. Failure to purge bubbles at the beginning of the deployment isn’t always problematic – most bubbles will naturally escape, especially under the higher pressure at depth. However, CTDs deployed too close to the surface may exit the water during low tide. This introduces new bubbles that can become trapped inside of the flow path. If your CTD is liable to exit the water, consult the CTD’s manual for the optimal deployment orientation, or contact our Technical Support team for recommendations.
This tech tip and more troubleshooting methods are captured without our Moored CTD Troubleshooting Basics guide.
https://www.seabird.com/cms-portals/seabird_com/cms/documents/Moored-CTD-Troubleshooting-Basics.pdf